A custom drone
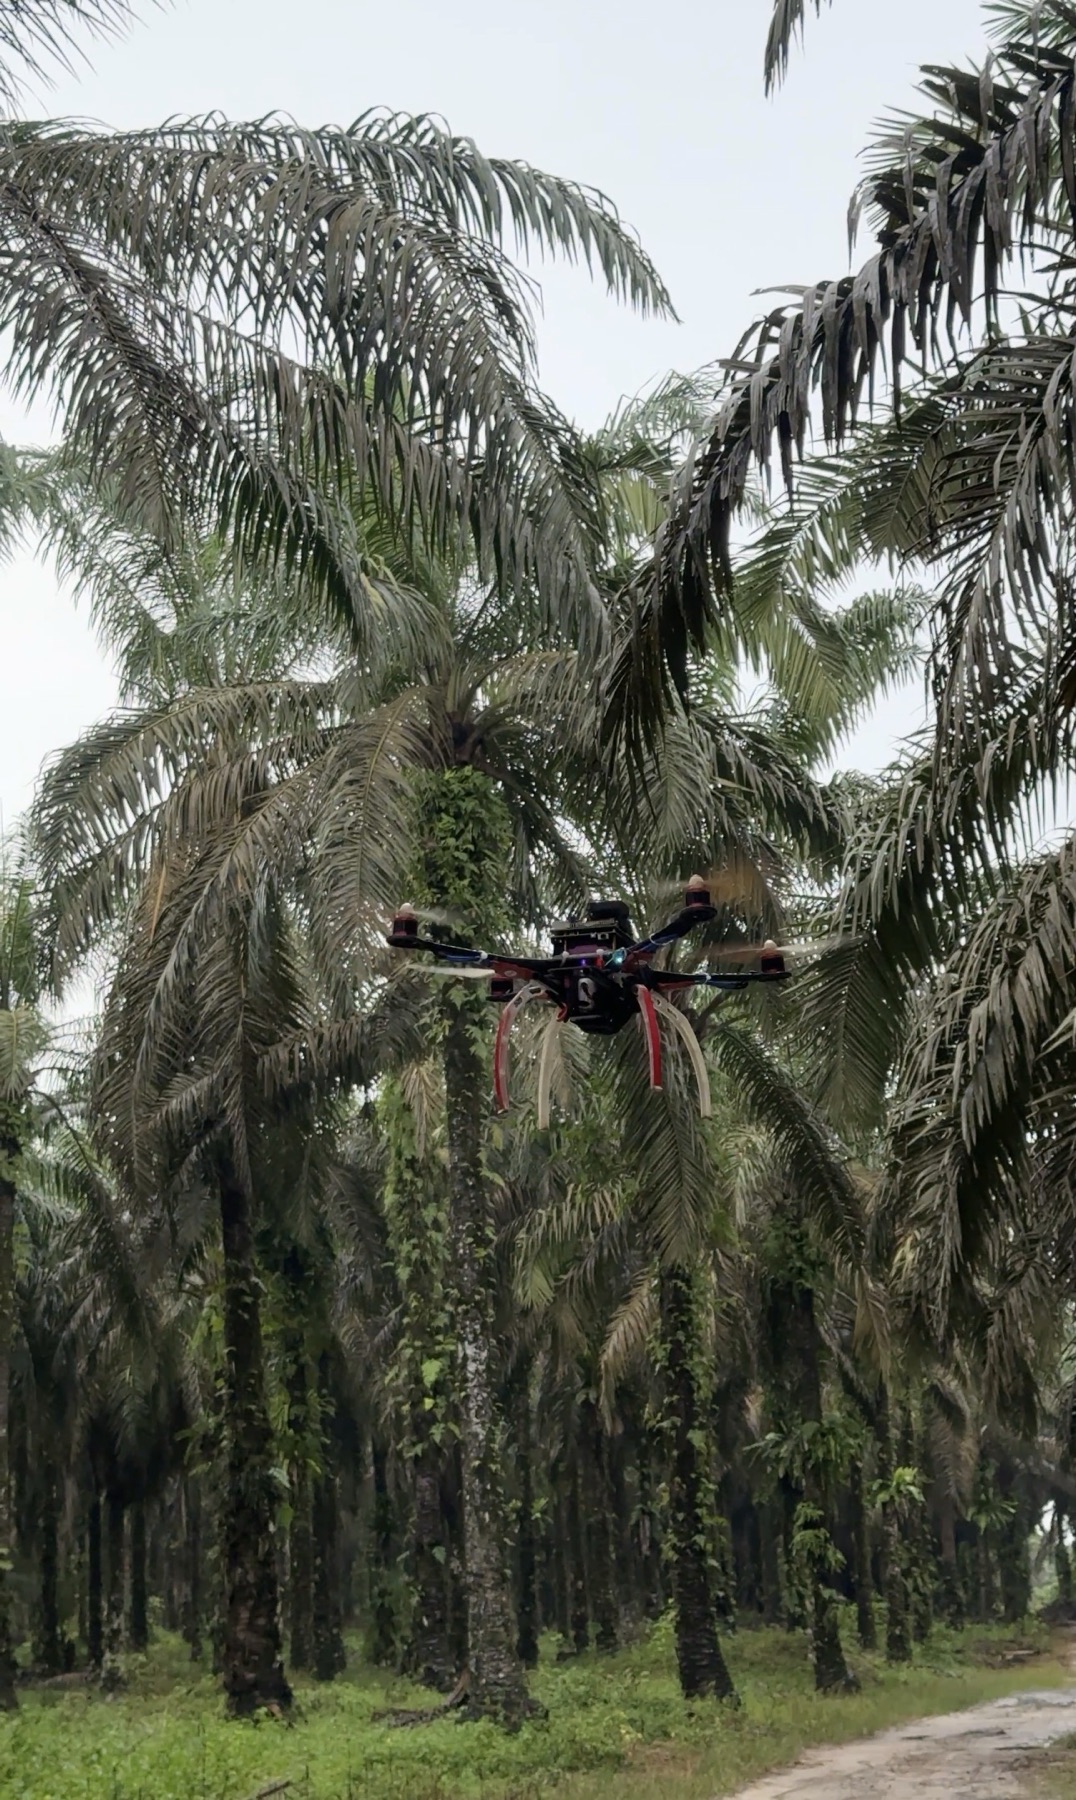
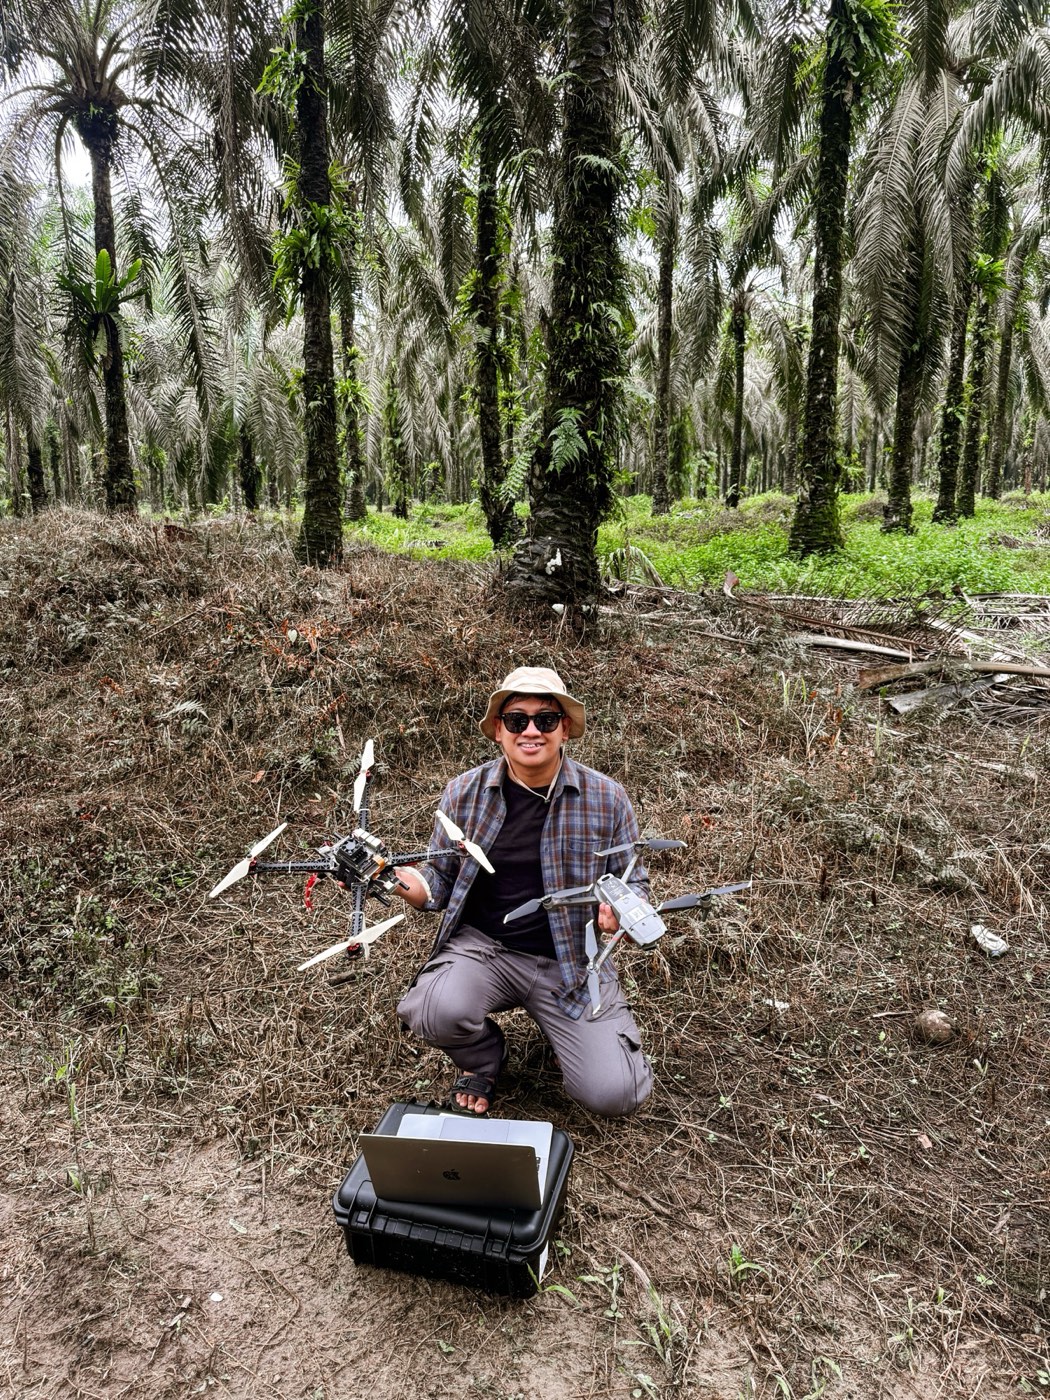
Built on an S500 quadcopter frame, carrying an NVIDIA Jetson Nano as its onboard computer.
Technology for Affordable Near-field Drone-based Assessment of Oil Palm Plantations
Affordable eyes in the sky for oil palm plantations.
02/14The problem
Indonesia is the world's largest palm oil producer. Oil palm contributes roughly 17% of Indonesia's agricultural GDP and employs up to 7.8 million people across its value chain (Purnomo et al., 2020), and palm oil supplies about 40% of global vegetable oil demand (Qaim et al., 2020). Indonesia's palm oil exports reached USD 22.97 billion in 2020 (Xin et al., 2022).
Keeping plantations productive means spotting problem trees early: dead palms, yellowing crowns, poorly maintained trees and stunted growth. Diseases such as basal stem rot (Ganoderma boninense) often become visible only at a late stage. Walking thousands of hectares to inspect trees by eye is slow, costly and inconsistent. Commercial drone-analytics services exist, but they are expensive and usually depend on cloud processing that remote plantations cannot rely on.
“The question was not whether AI can recognize a struggling palm — it was whether it can do so on hardware a plantation can actually afford.”
03/14What TANDAN is
Built on an S500 quadcopter frame, carrying an NVIDIA Jetson Nano as its onboard computer.
YOLO11n, recognizing five tree conditions, optimized to run on low-power edge hardware.
Monitoring software that tracks each tree, counts unique palms, computes a plantation health score and exports survey reports.
| Mode | How it works | Status |
|---|---|---|
| Onboard edge mode | Camera on the drone → Jetson Nano runs the optimized TensorRT engine on the aircraft | Engine validated on the Jetson Nano; in-flight integration in progress |
| Ground-station mode (TANDAN-V1) | Drone video streamed over RTMP → laptop runs detection, tracking and the live dashboard | Operational; used in field testing |
04/14The drone
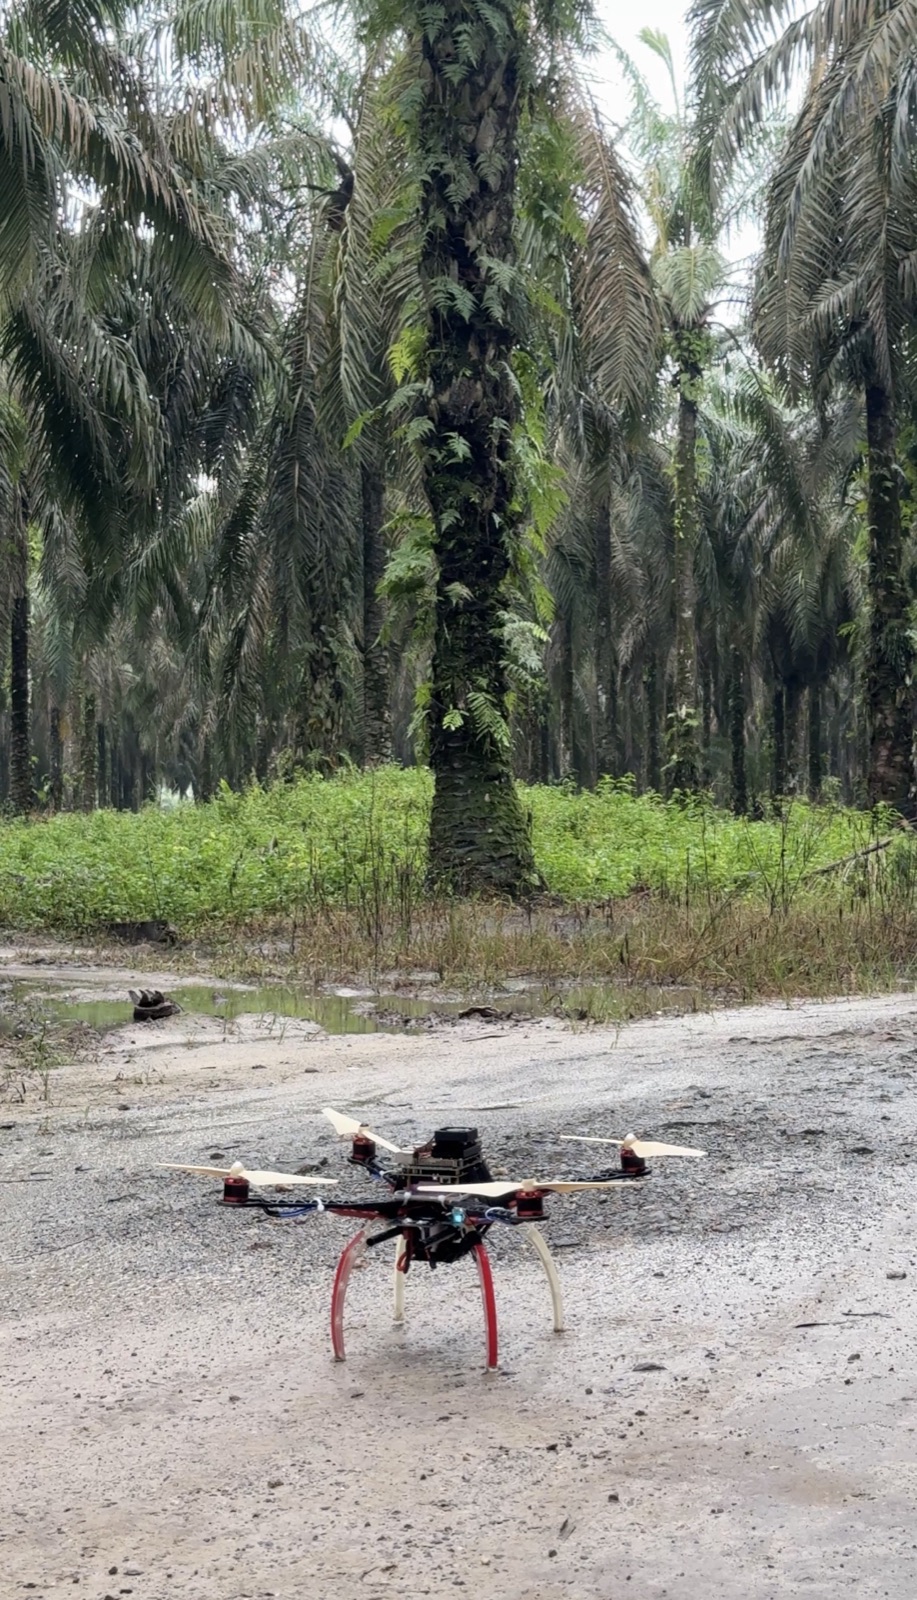
TANDAN uses a custom-built UAV rather than a closed commercial drone, so that the flight controller, onboard computer and camera can be integrated openly for research.
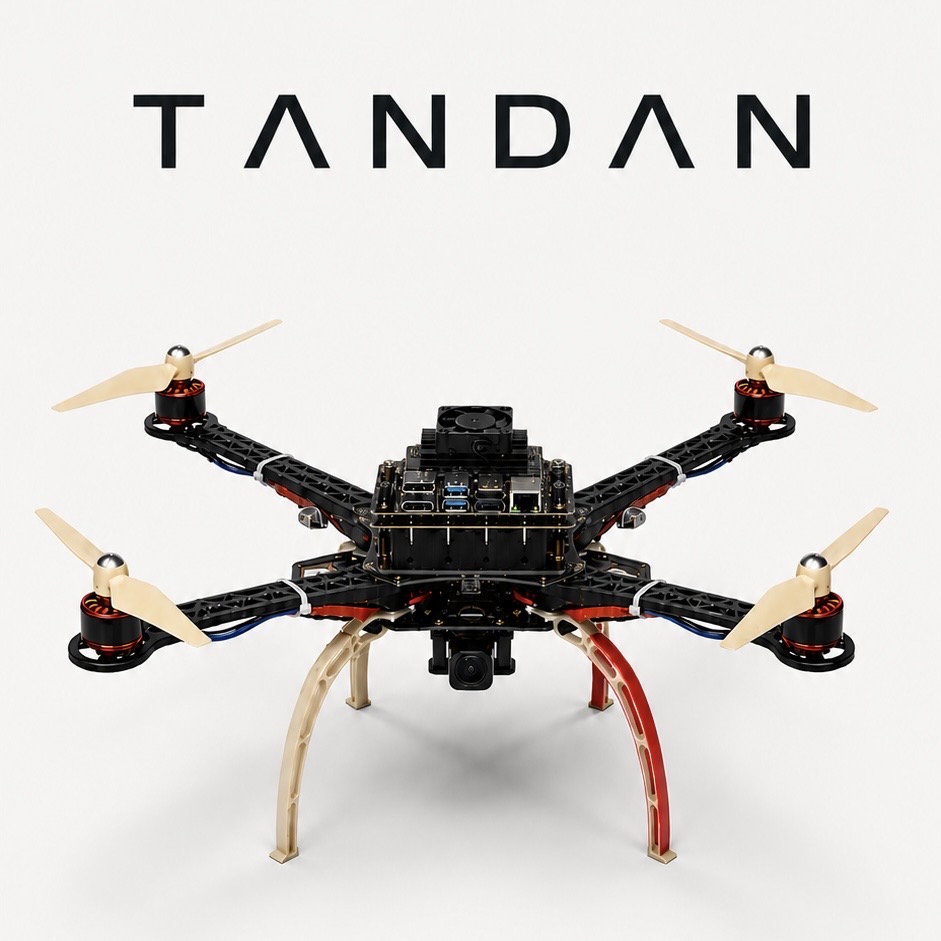
The build uses an open ArduPilot flight stack and off-the-shelf hobby-grade components. A closed agricultural flight controller (DJI N3-AG) was evaluated and not adopted, because its ecosystem does not expose the open interfaces that onboard AI integration needs.
| Frame | S500 quadcopter frame, 480–500 mm class |
|---|---|
| Flight controller | APM 2.6 (ArduPilot Mega) |
| Firmware | ArduPilot, configured with Mission Planner |
| Motors | 2212 920 KV brushless (×4) |
| ESCs | 20 A BLHeli-S (×4) |
| Propellers | 1045 (10 × 4.5 in) |
| Battery | LiPo 3S 2200 mAh |
| Radio transmitter | FrSky Taranis X9D Plus |
| RF link | RadioMaster Ranger Micro 2.4 GHz ExpressLRS (ELRS) external TX module with receiver |
| Onboard computer | NVIDIA Jetson Nano 4 GB (JetPack 4.6.6, CUDA 10.2, TensorRT 8.2.1) |
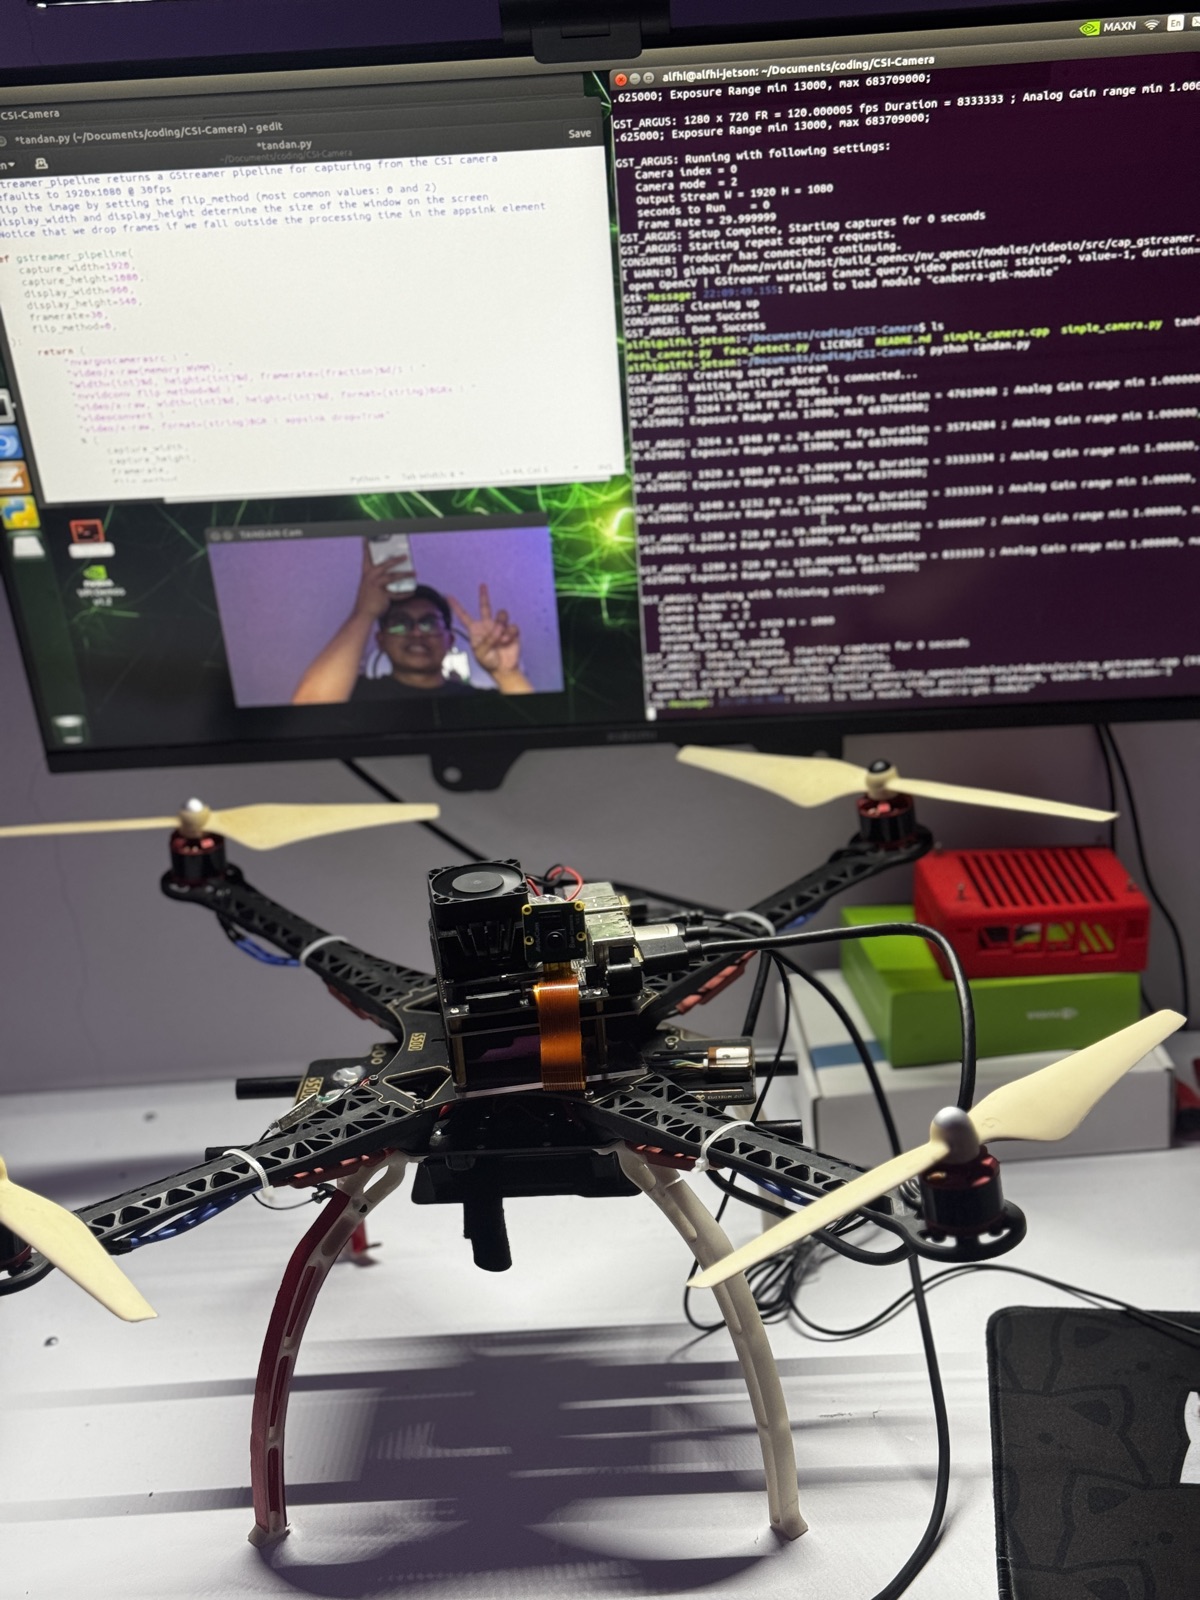
| Camera | Arducam IMX219 CSI camera (8 MP; sensor modes up to 3264 × 2464 @ 21 fps and 1280 × 720 @ 120 fps) |
Measured camera capture through the Jetson's hardware image pipeline: about 28.8 FPS at 1280 × 720 — well above the 15 FPS real-time threshold, so capture is not the bottleneck.
05/14The detection model
The model was trained on MOPAD (Multi-class Oil PAlm Detection dataset; Zheng et al., 2021), Site 2 subset.
| Class (EN) | Class (ID) | Meaning | Training instances |
|---|---|---|---|
| healthy | normal | Healthy mature palm | 89,958 |
| smallish | kecil | Small or stunted growth | 26,644 |
| yellowish | menguning | Yellowing crown, possible nutrient or disease stress | 1,473 |
| mismanaged | tidak terawat | Poorly maintained, overgrown surroundings | 431 |
| dead | mati | Dead palm | 231 |
The data is heavily imbalanced. The mismanaged class is both rare and hard, because it is recognized mainly from fine texture around the crown.
| Set | dead | healthy | mismanaged | smallish | yellowish | Total |
|---|---|---|---|---|---|---|
| Training | 231 | 89,958 | 431 | 26,644 | 1,473 | 118,737 |
| Validation | 61 | 24,884 | 95 | 7,395 | 411 | 32,846 |
| Total | 292 | 114,842 | 526 | 34,039 | 1,884 | 151,583 |
06/14The research journey
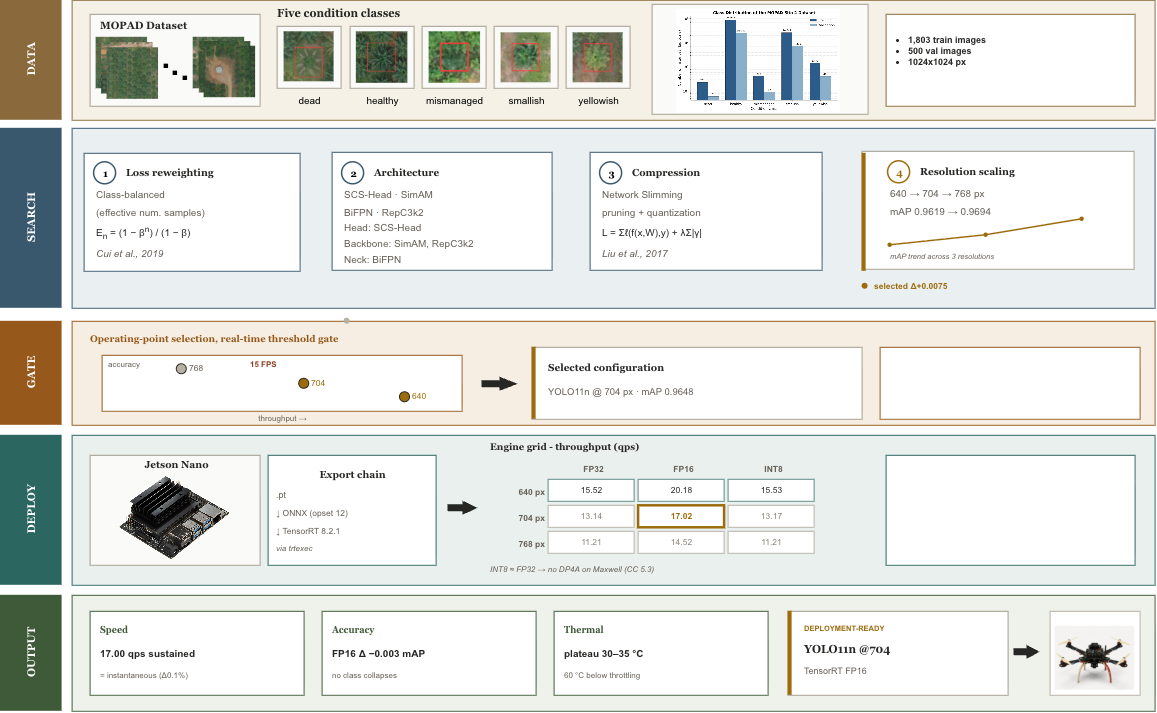
We tested nine ways to make the model smarter. None was adopted. Then we changed one thing — the image resolution.
Step 1
Four nano-sized YOLO models were compared in the same screening run.
| Model | mAP@0.5:0.95 | Params (M) | GFLOPs | FPS on Jetson | Real-time? |
|---|---|---|---|---|---|
| YOLOv8n | 0.9505 ± 0.0070 | 3.006 | 8.1 | 21.8 | Yes |
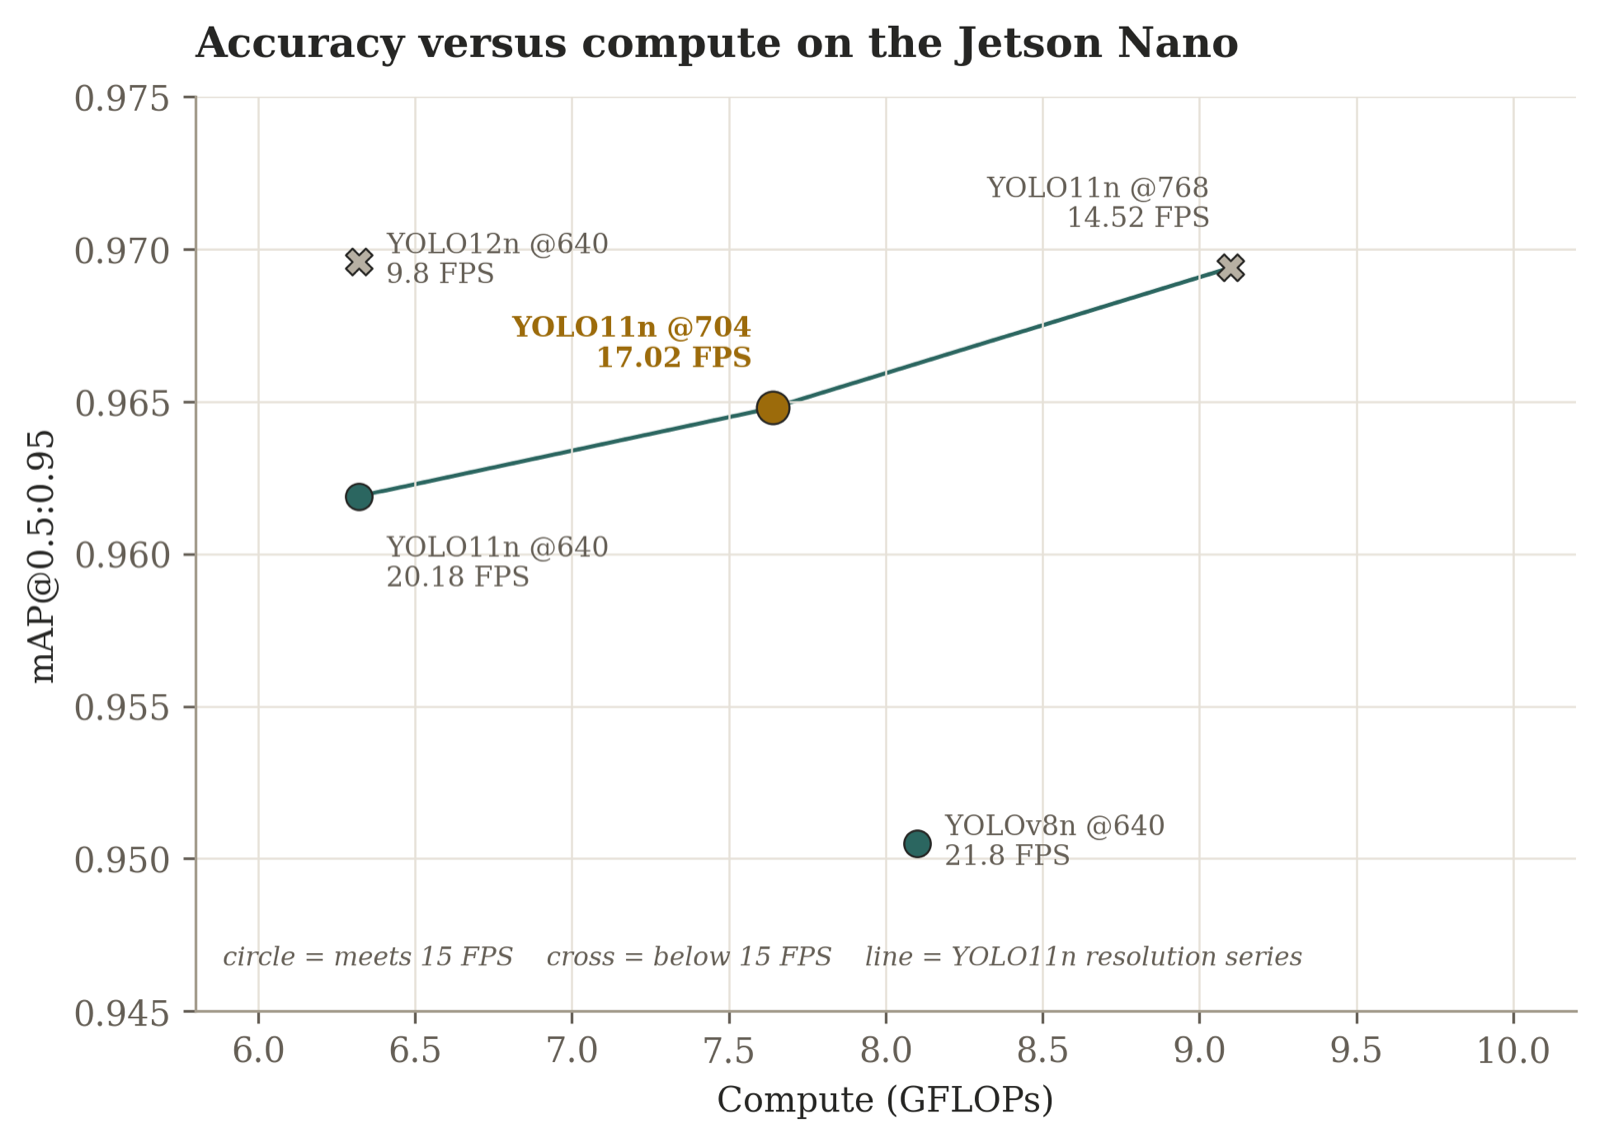
| YOLO11n | 0.9578 ± 0.0023 | 2.583 | 6.32 | 20.2 | Yes — selected |
| YOLO12n | 0.9696 ± 0.0026 | 2.558 | 6.32 | 9.8 | No |
| YOLO26n | 0.9394 ± 0.0074 | — | — | export failed | No |
YOLO12n was the most accurate but ran at only 9.8 FPS on the Jetson Nano, because its attention mechanism relies on hardware (FlashAttention / Tensor Cores) that the Nano's Maxwell GPU lacks. YOLO26n could not be exported to TensorRT. YOLO11n offered the best balance of accuracy, size and stability.
In the main experiments that followed, the YOLO11n baseline at 640 px measured 0.9619 ± 0.0023 — this is the reference used for every comparison below.
Step 2
Each was tested in isolation over the same baseline and judged against a statistical noise floor: the standard deviation of the baseline across three training seeds (42, 123, 456), ≈ 0.0023.
| Modification | mAP@0.5:0.95 | Change | Cost | Verdict |
|---|---|---|---|---|
| YOLO12n baseline | 0.9696 ± 0.0026 | — | 2.558 M params, 6.32 GFLOPs | reference |
| SPD-Conv (P3–P5) | 0.9692 ± 0.0048 | −0.0004 | 3.995 M params, 9.86 GFLOPs (+56%) | neutral, expensive |
| Varifocal Loss | 0.9756 (seed 42) | +0.0060 | unchanged | not adopted — background false positives rose 2.2× (364 → 809) |
| A2C2fRep (attention removed) | 0.9565 ± 0.0031 | −0.0131 | 2.927 M params, 6.79 GFLOPs | declined |
SPD-Conv is a small-object technique, but oil palm crowns are medium-sized objects (about 62 px), so it added 56% compute for no gain.
| Modification | Part changed | mAP@0.5:0.95 | Verdict |
|---|---|---|---|
| Class-balanced focal loss (Cui et al., 2019) | Loss | 0.9597 ± 0.0021 | neutral |
| SCS-Head (shared-convolution head) | Head | 0.9156 | failed |
| SimAM parameter-free attention (Yang et al., 2021) | Backbone | 0.9501 | failed |
| RepC3k2 re-parameterization (after Ding et al., 2021) | Backbone | 0.9509 | declined |
| BiFPN weighted feature fusion (Tan et al., 2020) | Neck | 0.9586 | neutral |
| Network Slimming structured pruning (Liu et al., 2017) | Whole network | channels did not polarize — halted | failed |
| BN scale statistic | Before | After | Needed |
|---|---|---|---|
| Mean absolute value | 1.1045 | 1.0644 | ≪ 1.0 |
| Channels < 0.01 | 0.013% | 0.013% | > 20% |
| Channels < 0.10 | 0.026% | 0.026% | > 30% |
The class-balanced loss shifted where false positives went (background → healthy dropped from 66.3% to 52.6%) but did not remove them — they moved to smallish (31.0% → 42.1%).
Step 3
| Input resolution | mAP@0.5:0.95 | GFLOPs | AP mismanaged | Seeds |
|---|---|---|---|---|
| 640 px | 0.9619 ± 0.0023 | 6.32 | 0.894 | 3 |
| 704 px | 0.9648 | 7.64 | 0.908 | 1 |
| 768 px | 0.9694 ± 0.0026 | 9.1 | 0.926 | 3 |
Raising resolution from 640 to 768 px improved mAP by 0.0075 — more than three times the noise floor — and brought YOLO11n level with YOLO12n (0.9696) while remaining deployable. The hardest class, mismanaged, gained over three points.
Step 4
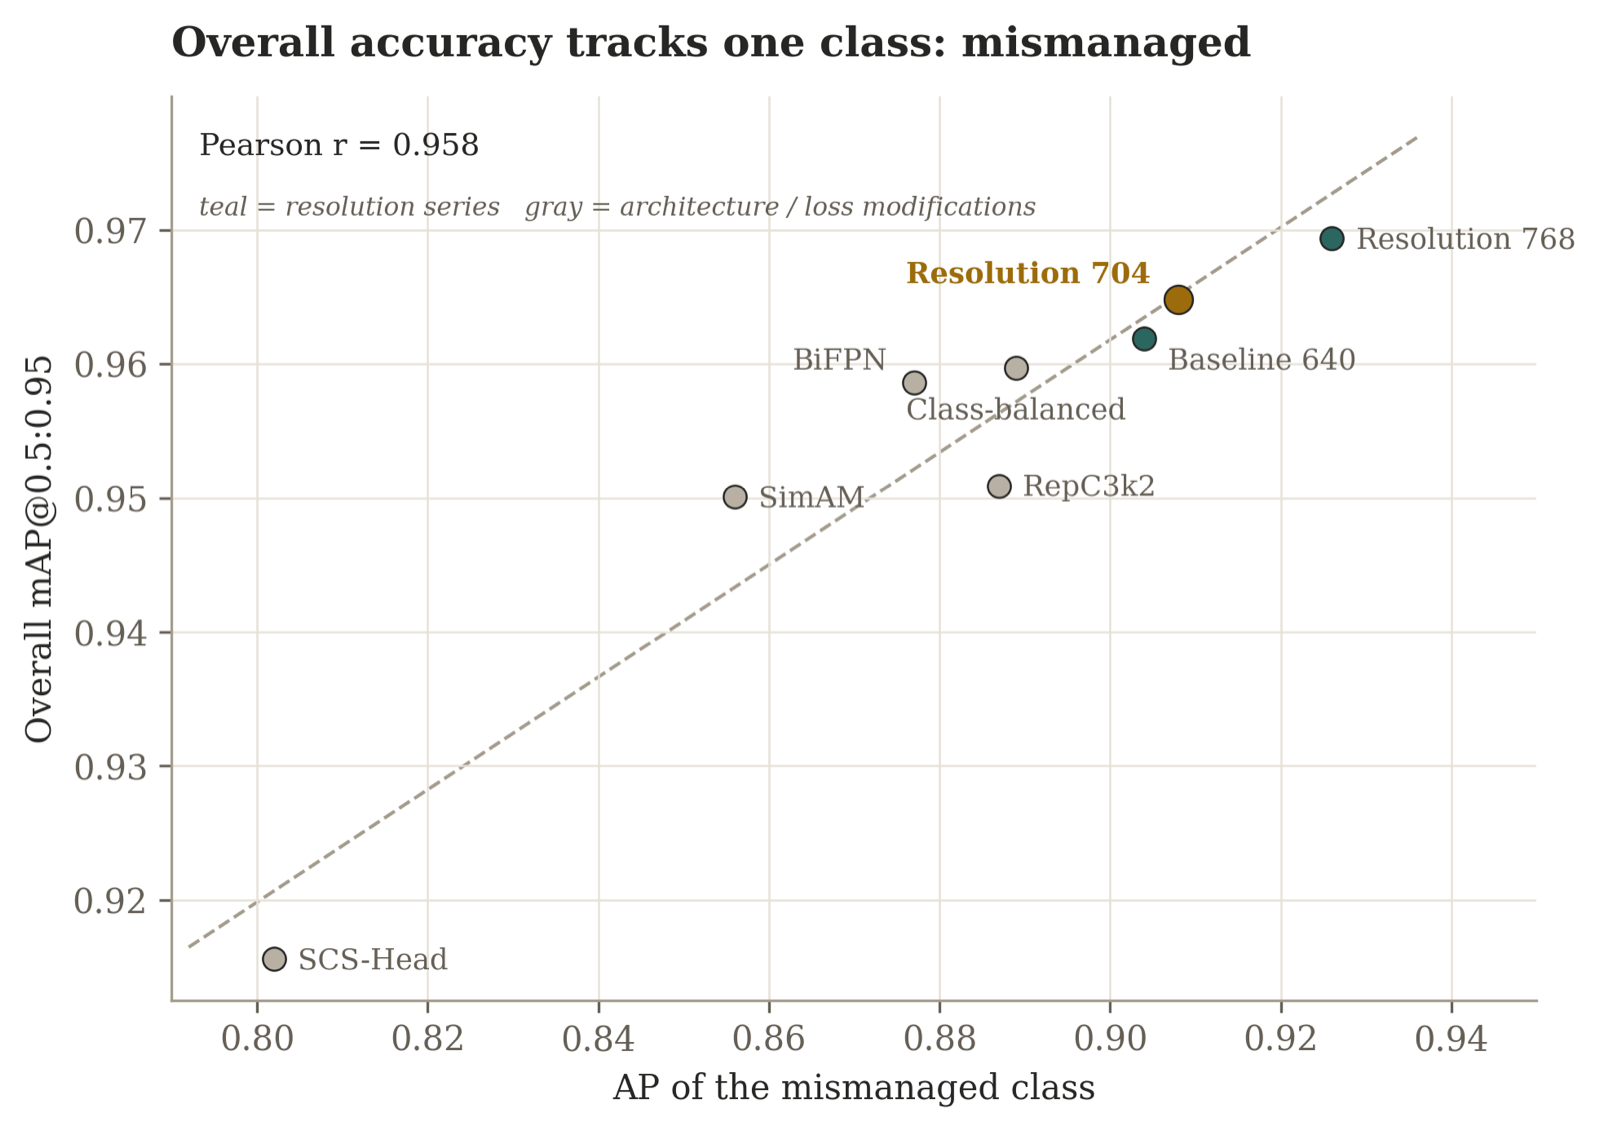
Per-class accuracy across eight configurations. Spread of each class across configurations: healthy 0.021, dead 0.043, yellowish 0.048, smallish 0.050, mismanaged 0.125 — two to six times wider than any other class. Ranking configurations by mismanaged accuracy almost reproduces the ranking by overall mAP; the other four classes were already saturated.
Hover or focus a point to see its configuration. Gold = resolution 768.
| Configuration | dead | healthy | mismanaged | smallish | yellowish |
|---|
Key insight
The bottleneck was pixels, not model capacity. Fine crown texture disappears when images are downsampled, and no module can recover information that is not in the input. The nine rejected modifications are not wasted effort — they are the evidence that ruled every other explanation out.
Error diagnosis. Most errors were not confusion between classes but background mistaken for trees — about 66% of background false positives were labeled healthy and 31% smallish.
07/14Edge deployment on Jetson Nano
Throughput (queries per second) · three resolutions × three precisions
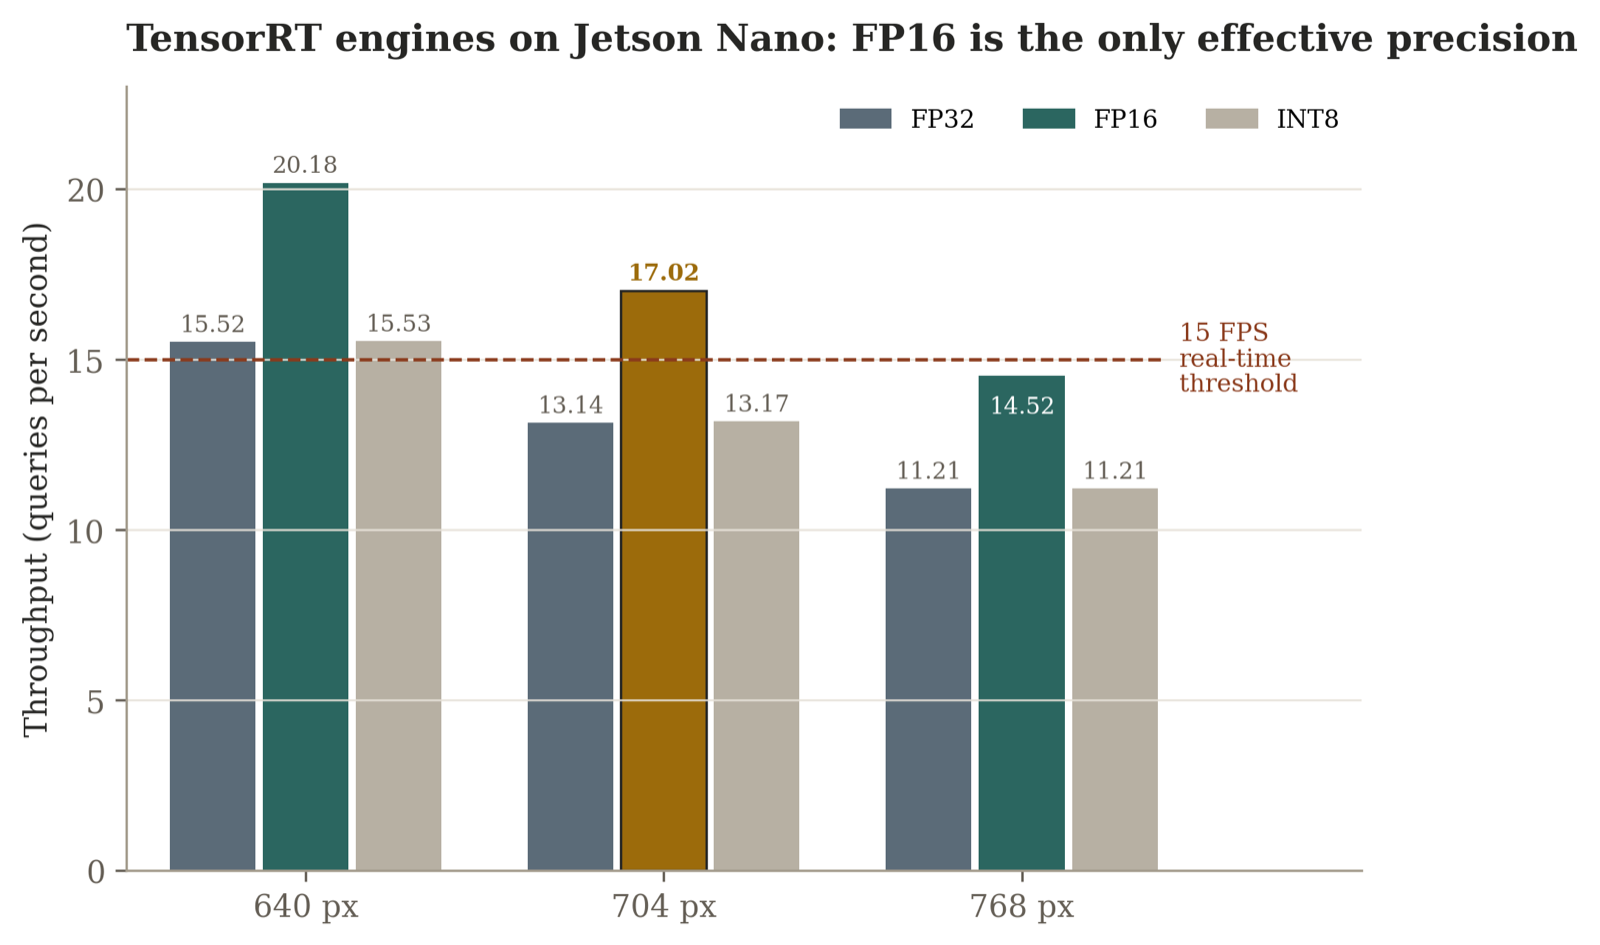
Measured on the Jetson, using PyTorch half precision as a numerically equivalent proxy because TensorRT's Python bindings are unavailable for Python 3.8 on JetPack 4.6.
| Class | FP32 | FP16 | Δ |
|---|---|---|---|
| dead | 0.979 | 0.981 | +0.002 |
| healthy | 0.993 | 0.993 | 0.000 |
| mismanaged | 0.931 | 0.927 | −0.004 |
| smallish | 0.977 | 0.971 | −0.006 |
| yellowish | 0.988 | 0.986 | −0.002 |
| all | 0.974 | 0.971 | −0.003 |
313 s of continuous inference.
| Metric | Idle | Under load |
|---|---|---|
| GPU temperature | 23.1 °C | 21.5 → 30.5 °C, plateau, max 35.0 °C |
| CPU temperature | 21.4 °C | 21.5 → 31.5 °C, max 36.5 °C |
| GPU utilization | ~0% | stable 89–98% |
| Throughput | — | 17.0025 qps sustained vs 17.02 instantaneous (Δ 0.1%) |
No thermal throttling: temperatures plateaued more than 60 °C below the ~97 °C throttling point, and sustained throughput matched the instantaneous value.
Final configuration
08/14TANDAN-V1 monitoring software
TANDAN-V1 turns raw detections into survey information a plantation manager can use.
track ID · class · confidence.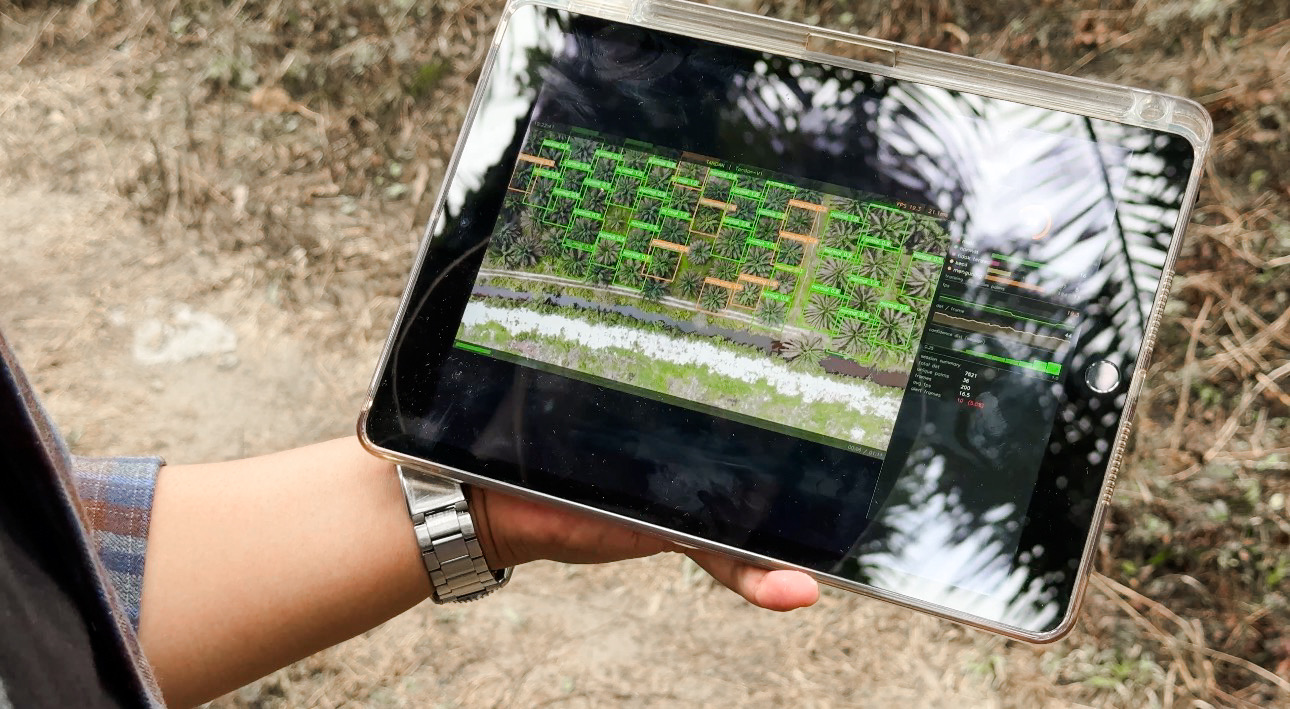
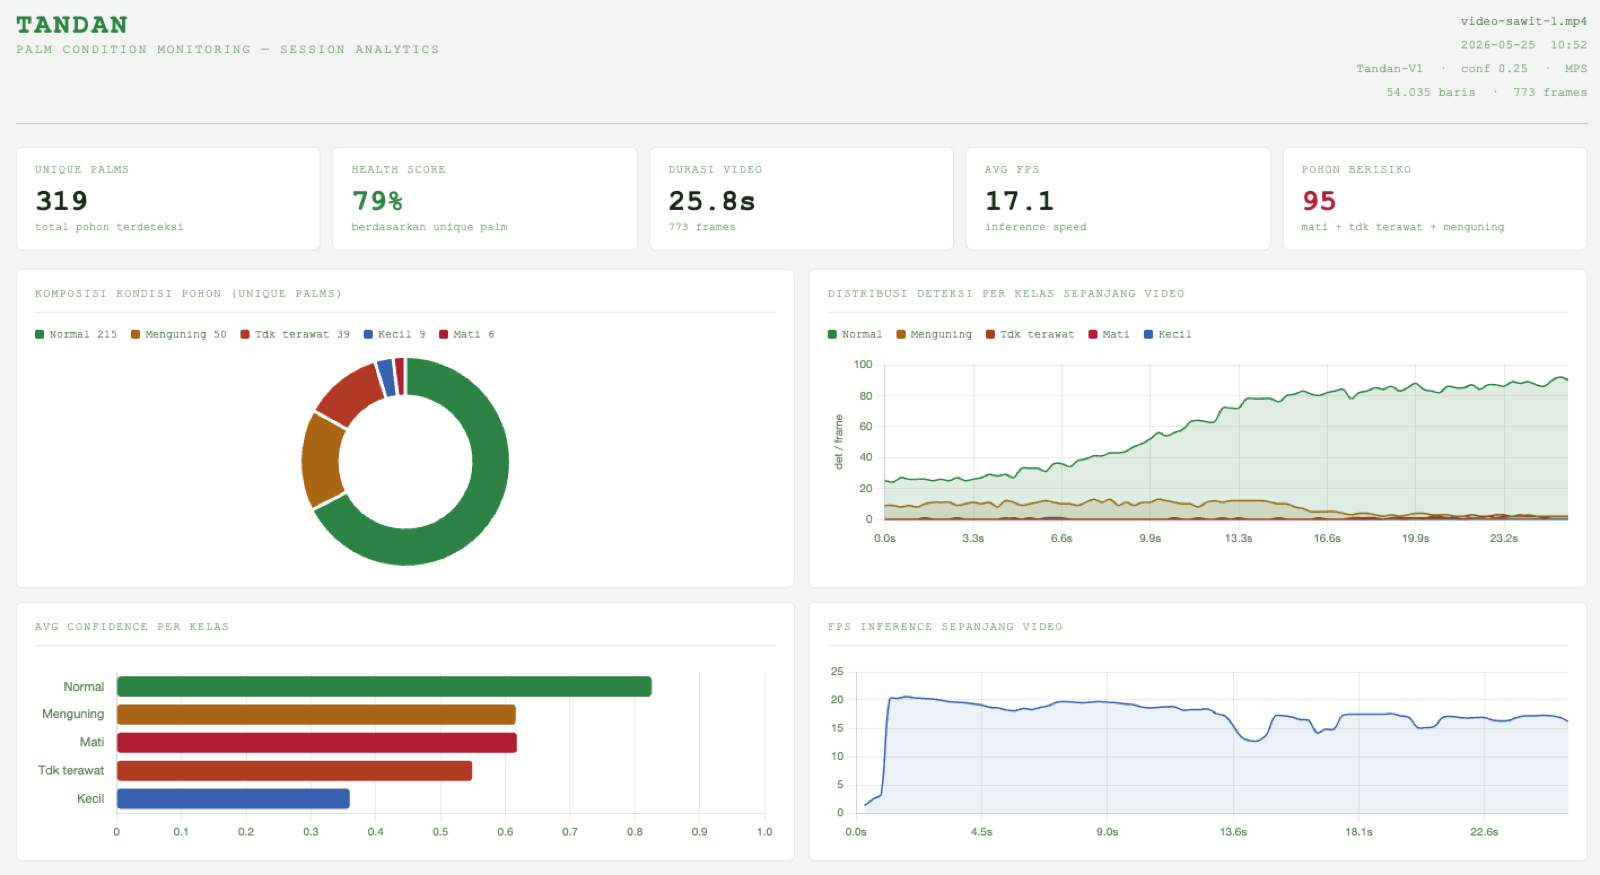
good  = healthy + 0.7 × smallish
bad   = dead + 0.8 × mismanaged + 0.4 × yellowish
score = good / (good + bad) × 100
        (computed on unique palms)
Adjust the five class counts to see how the score and gauge colour respond.
09/14Field testing
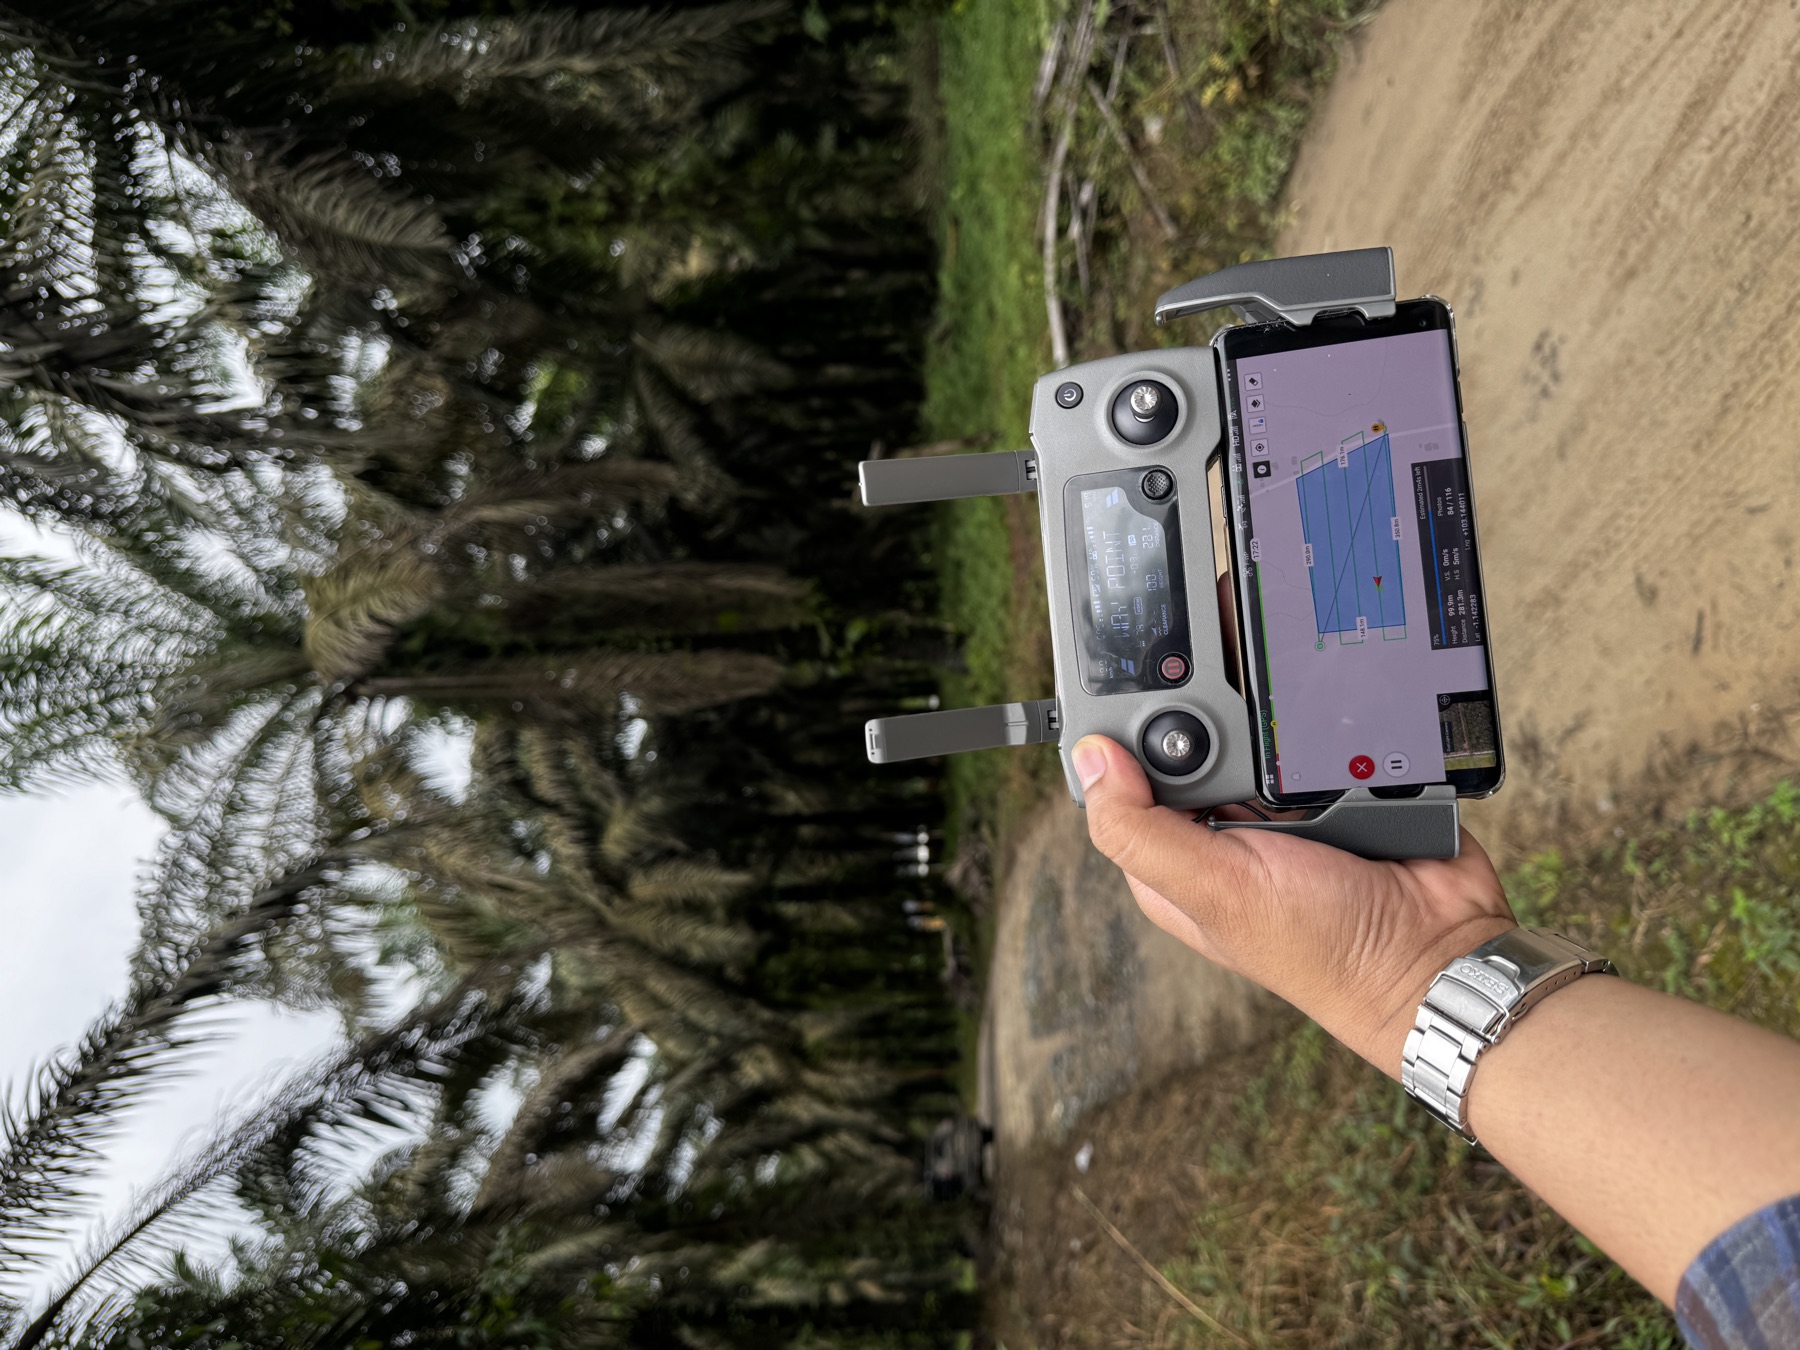
TANDAN was tested at an oil palm plantation in Kabupaten Tanjung Jabung Barat, Jambi, Indonesia. Aerial imagery was processed into orthomosaics with Agisoft Metashape, and the detector — trained on data from a different region — was applied to the new site's imagery.
10/14Results at a glance
mAP@0.5:0.95 at 768 px — level with a newer, heavier model
mAP at the deployed 704 px
mAP from resolution alone (3× the noise floor)
modifications tested, none adopted
sustained on a Jetson Nano, 13% above the real-time threshold
speedup from FP16; none from INT8
mAP cost of FP16
thermal headroom under continuous load
parameters
11/14Network architecture
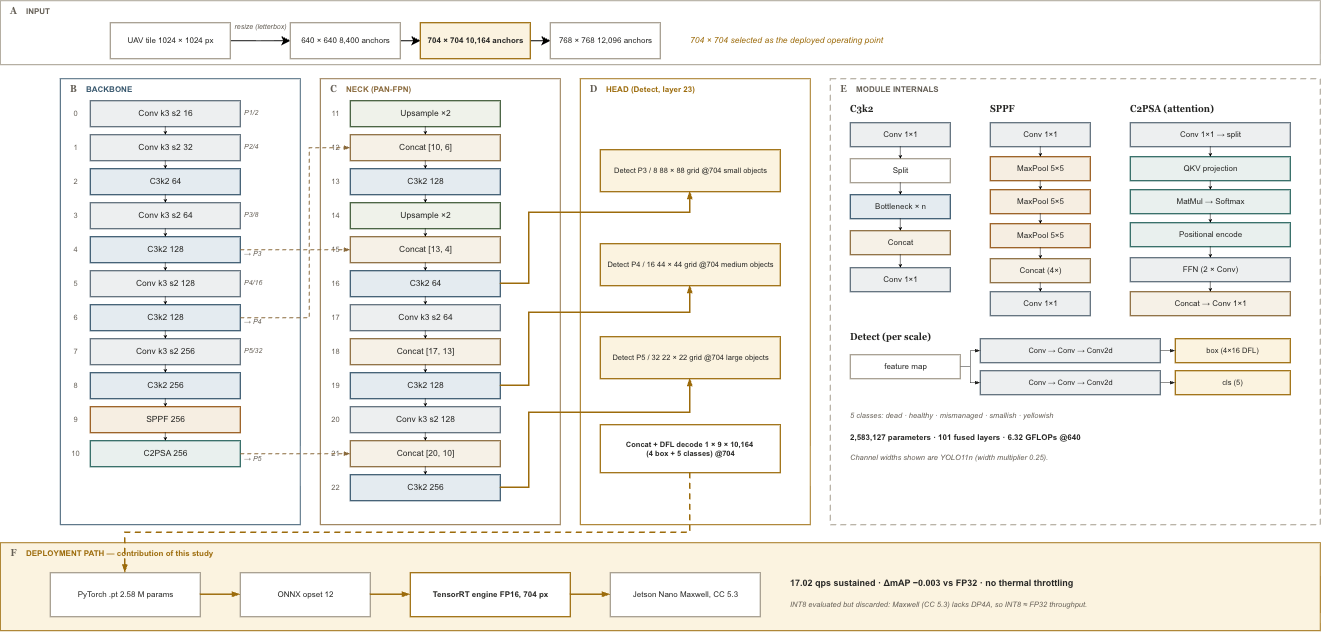
The deployed network is stock YOLO11n. The contribution is the resolution choice and the deployment pipeline, not a new architecture.
12/14Status
13/14Team
Dissertation
Development of an Efficient Real-Time UAV-Based Detection System for Oil Palm Condition Monitoring
Pengembangan Sistem Deteksi Berbasis Real-Time-UAV yang Efisien untuk Monitoring Kondisi Kelapa Sawit
Doctoral dissertation, Doctor of Computer Science.
References